
Textiles & Apparel / Garment
Levi Strauss & Co. reports third-quarter 2023 financial results
Levi Strauss & Co. (NYSE: LEVI) today announced financial results for the third quarter ended August 27, 2023.
“We delivered Adjusted EBIT and Adjusted diluted EPS in line with our expectations while navigating a challenging operating environment,” said Harmit Singh, chief financial and growth officer of Levi Strauss & Co. “While we saw sequential improvement in the business across the company as we moved through Q3 with both July and August up versus prior year, given the ongoing uncertainty in the macro environment, we are taking a cautious approach to our outlook for the fourth quarter. As we accelerate our transition to a DTC-led company, we have commenced an initiative to review our operating model and cost structure that should drive agility and material cost savings beginning in 2024.”
Financial Highlights
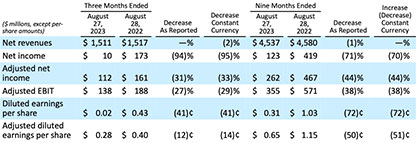
• Net Revenues of $1.5 billion were consistent with the prior year on a reported basis and 2% lower on a ?constant-currency basis versus Q3 2022.
• DTC (Direct to Consumer) net revenues increased 14% on a reported basis and 13% on a constant- currency basis, driven by broad-based growth in both company-operated mainline and outlet stores and e-commerce. Revenues from e-commerce grew 19% on a reported basis and 18% on a constant-currency basis reflecting double-digit growth across all brands. As a percentage of third quarter net revenues, DTC comprised 40% of total net revenues.
• Wholesale net revenues declined 8% on a reported basis and 10% on a constant-currency basis as growth in Asia and Latin America was offset by declines in North America and Europe.
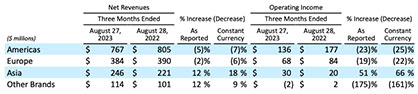
• In the Americas, net revenues decreased 5% on a reported basis and 7% on a constant-currency basis. DTC net revenues increased 12% on a reported basis and 11% on a constant-currency basis driven by company-operated mainline and outlet stores and e-commerce. Wholesale net revenues decreased 12% on a reported basis and 14% on a constant-currency basis as softness in North America was partially offset by growth in Latin America.
• In Europe, net revenues decreased 2% on a reported basis and 6% on a constant-currency basis; excluding Russia, net revenues decreased 3% on a constant-currency basis. DTC net revenues increased 10% on a reported basis and 6% on a constant-currency basis, and 11% excluding Russia, driven by company-operated mainline and outlet stores and e-commerce. Wholesale net revenues decreased 10% on a reported basis and 14% on a constant-currency basis, reflecting the cautious order environment among wholesale partners.
• Asia net revenues increased 12% on a reported basis and 18% on a constant-currency basis, reflecting growth across almost all markets, including strong growth in China. DTC net revenues rose 15% on a reported basis and 23% on a constant-currency basis, driven by strength in company-operated mainline and outlet stores and e-commerce. Wholesale net revenues increased 8% on a reported basis and 13% on a constant-currency basis.
• Other Brands net revenues increased 12% on a reported basis and 9% on a constant-currency basis. Dockers® increased 9% on a reported basis and 5% on a constant-currency basis as strong growth internationally and in DTC was partially offset by U.S. wholesale. Beyond Yoga® rose 25% on reported and constant-currency bases.
• Operating margin of 2.3% was down from 13.1% in Q3 2022 as a result of higher SG&A expenses and an impairment charge of $90.2 million related to the Beyond Yoga® acquisition, and lower net revenues and gross margin. Adjusted EBIT margin declined 330 basis points to 9.1% from 12.4% last year due to gross margin contraction and SG&A deleverage due to higher DTC expenses.
- Gross margin was down 130 basis points to 55.6% from 56.9% in Q3 2022. Adjusted gross margin was down 130 basis points to 55.6% from 56.9% last year. The decline in Gross margin and Adjusted gross margin was driven by lower full-price sales, strategic pricing actions and higher product costs. These impacts were partially offset by favorable channel and geographic mix, as well as lower air freight expenses and favorable currency exchange.
- Selling, general and administrative (SG&A) expenses were $715 million compared to $664 million in Q3 2022. Adjusted SG&A was $702 million compared to $675 million last year, reflecting higher planned expenses to support DTC expansion.
• Interest and other expenses, which include foreign exchange losses, were $38 million compared to $13 million in Q3 2022. The increase in expenses was primarily driven by a $19 million pension settlement loss and foreign currency transaction losses reflecting the impact of rate fluctuations on foreign denominated balances.
• The effective tax rate was 386.6% compared to 7.2% in Q3 2022. The increase in the effective tax rate is primarily driven by the foreign-derived intangible income deduction on a proportion to losses before income taxes. Additionally, the non-cash impairment charge related to the Beyond Yoga® acquisition resulted in an income tax benefit of $22 million. Excluding the impact of the impairment, the tax rate would be 10% for Q3 2023.
• Net income was $10 million compared to net income of $173 million in Q3 2022. Adjusted net income was $112 million compared to $161 million in Q3 2022.
• Diluted earnings per share was $0.02 compared to diluted earnings per share of $0.43 in Q3 2022. The recognition of the Beyond Yoga® impairment unfavorably impacted diluted earnings per share by $0.17, net of tax. Adjusted diluted earnings per share was $0.28 compared to $0.40 in Q3 2022.
Additional information regarding Adjusted gross margin, Adjusted SG&A, Adjusted EBIT, Adjusted EBIT margin, Adjusted net income, Adjusted diluted earnings per share, as well as amounts presented on a constant-currency basis, all of which are non-GAAP financial measures, is provided at the end of this press release.
Balance Sheet Review as of August 27, 2023
• Cash and cash equivalents were $295 million, while total liquidity was approximately $1.1 billion.
• The company’s leverage ratio was 1.6 as compared to 1.1 at the end of Q3 2022.
• Total inventories increased 6% on a dollar basis. Approximately 5% of the year-over-year increase is due to the modification of terms with the majority of our suppliers that results in the company taking ownership of inventory for goods being brought into the Americas closer to the point of shipment rather than destination. This is consistent with existing terms for goods sent to Europe and Asia. The remaining 1% increase represents a 17 point improvement from last quarter and reflects U.S. inventory levels below prior year’s level . We continue to expect sequential progress, achieving total company inventory levels below prior year levels by year end.
Additional information regarding leverage ratio, which is a non-GAAP financial measure, is provided at the end of this press release.
Shareholder Returns
• The company returned approximately $48 million to shareholders in the third quarter, in dividends representing $0.12 per share, in line with Q3 2022.
• The company did not repurchase any shares in the quarter. At quarter end, the company had $680 million remaining under its current share repurchase authorization, which has no expiration date.
• The company declared a dividend of $0.12 per share, totaling approximately $48 million. The dividend is payable in cash on November 9, 2023 to the holders of record of Class A common stock and Class B common stock at the close of business October 26, 2023.
Fiscal 2023 Guidance
• Reported net revenues are expected flat to up 1% year-over-year.
• Adjusted diluted EPS is expected to be on the low-end of the previously guided range of $1.10 to $1.20.
• More details will be provided during the earnings conference call.
This outlook also assumes no significant worsening of macro-economic pressures on the consumer, inflationary pressures, supply chain disruptions, or currency impacts. A reconciliation of non-GAAP forward looking information to the corresponding GAAP measures cannot be provided without unreasonable efforts due to the challenge in quantifying various items including but not limited to, the effects of foreign currency fluctuations, taxes, and any future restructuring, restructuring-related, severance and other charges.